Imagine spotting stock reversals before anyone else—Gartley and Fibonacci cracked the code, and pulse ai turned it into your profit machine. Our algorithm scans up to 10,000 stocks a minute, delivering harmonic pattern alerts in seconds&mdashso you cash in first.
Why Patterns Matter: The Secret to Big Wins
Chaos hides order—and in stock trading, that order means money. Price/time charts—those wild candlesticks with opens, highs, lows, and closes—look messy, but patterns emerge. Forget continuation trends that drone on with low volatility. Reversal patterns, like WM and Gartley, thrive in chaos, signaling big moves. Volatility drives 80% of major profits—and we’ve got the tool to catch it.
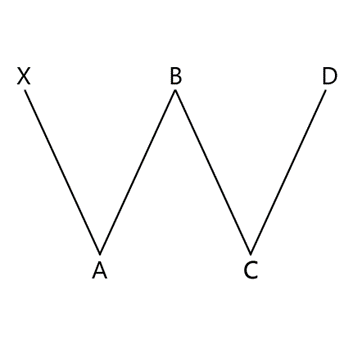
Why do these patterns form? Human behavior. Prices aren’t just numbers—they’re traders reacting to news, fear, and greed. A W-pattern starts with a sell-off, short sellers pile in, then buyers spot value and flip it. Another dip, another rally—predictable swings, if you know where to look. pulse ai does.
Harmonic Power: Gartley Meets Fibonacci
In 1932, H.M. Gartley unveiled a 5-point reversal pattern in Profits in the Stock Market—a shape that predicts turns with uncanny accuracy. Larry Pesavento turbocharged it with Fibonacci ratios in Fibonacci Ratios with Pattern Recognition, turning it into a trader’s goldmine. Harmonic patterns—like Gartley, Butterfly, Bat, Crab, Shark, and Cypher—use these ratios to map swing points, retracements, and extensions. When the lines align with Fibonacci magic (e.g., 0.618, 1.618), the odds of a win skyrocket—68% in our 2024 backtesting.
Manually? It’s a slog—hours of chart-watching and line-drawing. Vivimetrix? We automate it, scanning millions of charts to nail those ratios in seconds.
Vivimetrix Advantage: Patterns That Pay
W Pattern (Double-Bottom) – Bullish Bliss
A W dips twice, then soars—if the Fibonacci ratios hold. Enter at the C-D retracement, and watch others bid it up. September 13, 2024: Our algorithm flagged CEG at $178.69, entry at $196.74, targeting $211.34—hit$259.44 +30.02% profit in 96 hours while others scrambled.
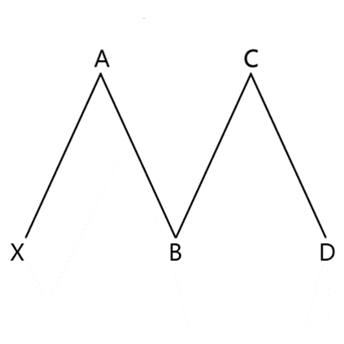
M Pattern (Double-Top) – Bearish Bounty
The M flips it—two peaks, then a plunge. Perfect for shorts or put options. February 3, 2025: We alerted TFX at $174.61, targeting $169.02—3.3% gain on the drop, before the crowd caught on. It eventually hit $130.43 for a gain of 25.14%.
Our algorithm doesn’t guess—it delivers entry, exit, and stop-loss targets, averaging 1.34% (Swing Trading) and 0.15% (Day Trading) daily gains (2025 YTD). Stop chasing—start winning.
Fibonacci: The Math That Moves Markets
Fibonacci didn’t chase stocks—he counted rabbits. His sequence (1, 1, 2, 3, 5, 8, 13…) builds by adding the last two numbers, and dividing pairs (e.g., 8/5 = 1.6) nears the Golden Ratio: 1.618. Found in nature—pentagons, honeybees, even DNA—it’s no shock it rules trading too. Ratios like 0.618, 0.786, and 1.618 define harmonic patterns, predicting reversals with eerie precision.
The catch? Calculating them by hand takes forever. pulse ai crunches up to 19 million data points across up to 3.9 million charts each trading day*, delivering alerts faster than you can blink.
Stop Chasing, Start Winning
Why draw Fibonacci lines when Vivimetrix does it for you? From Gartley to WM, our algorithm spots the signals, so you catch the trades. Ready to trade smarter?

*For a single stock, our algorithm ingests up to 390 data points every minute assessing against up to 5 points for each pattern in under 5 milliseconds.


