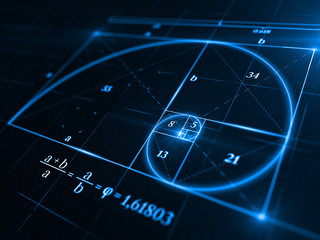
The world is an amazing place, especially when viewed through the seemingly magical glasses of mathematics. That which appears to be random or even chaotic begins to yield patterns that not only describe repeatable structure but enables us to make predictions about the continued formation of such patterns.
In the financial world we look at charts, specifically price/time charts. These charts have two-dimensions – two axes – known as x and y in geometry. The x axis represents the time intervals (seconds, minutes, hours, days, weeks, months, years) and the y axis represents the price. Specifically with stock (and similar) charts, there are generally multiple prices in each data point that must be represented: the open price, high price, low price, and close price. So, we use a candlestick chart to properly display these prices. The main part of each "candle" is called the real body and indicates the open and close prices while the lines above and below – called shadows or wicks – are used to indicate the high and low prices.
These charts can be more difficult to look at than a standard line chart. But even to the human eye patterns start to emerge.
Patterns are categorized as either "continuous" or "reversal" patterns. We are primarily concerned with reversal patterns as a continuation pattern most often indicates that a price will simply continue in a given direction without much volatility and volatility generally yields the greater opportunity for higher profits. Therefore, the reversal patterns inherent in greater volatility are exactly what we are looking for.
Why do patterns form?
Market prices are, in simplest terms, a reflection of human behavior. Certainly, initial prices are set based on hard numbers, but fluctuations over time are really due to actions taken by traders in response to information they receive. That puts human behavior at the heart of market prices.
Even something as chaotic seeming as human behavior forms patterns. The behavioral aspect of a basic W-shaped pattern is very simple: A stock price drops due to bit of a sell-off, short sellers enter the fray driving the price down further. Once the price drops below the point where it is certainly valued higher, traders of all types see value in buying knowing that the trend is likely not a continuation trend. Once that happens, it triggers another sell-off. Those who felt they were stuck at the bottom of the dip sell as it climbs higher, those who bought at the bottom sell for a quick profit. Once it again, drops enough, there is a high degree of certainty that it will again return to its previous price which means it is a good time to buy after it reverses and starts higher. Sometimes this trend can repeat multiple times and result in a 3-drive pattern, or even further.
And that just describes a basic W-shaped pattern.
Harmonic Patterns
In 1932, in his book Profits in the Stock Market, H.M. Gartley wrote about a 5-point pattern simply known as Gartley. Later, in Fibonacci Ratios with Pattern Recognition, Larry Pesavento improved upon this pattern using Fibonacci ratios and even established rules on how to trade Gartley patterns.
Harmonic patterns are based on patterns that form in price movements over time which meet certain criteria based on Fibonacci-derived ratios. It's amazing how these ratios accurately describe these patterns in any market using a price-time chart. The basic idea is to find valid retracements and extensions, high and low turning points from which these retracements and extension form – also known as swing points. If the relationship of these lines that are formed match desirable Fibonacci ratios, the odds for a positive outcome increase greatly. Then, using these lines, along with projections based on the ratios, it is possible to find key targets for action.
Types of Patterns
The basic WM - double-bottom, double-top - patterns are further categorized into more specific shapes such as Gartley, Butterfly, Bat, Crab, Shark and Cypher. They all describe WM patterns that differ in shape due to the different Fibonacci ratios required.
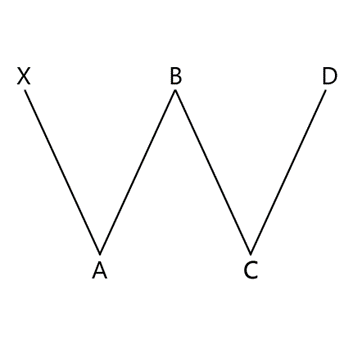
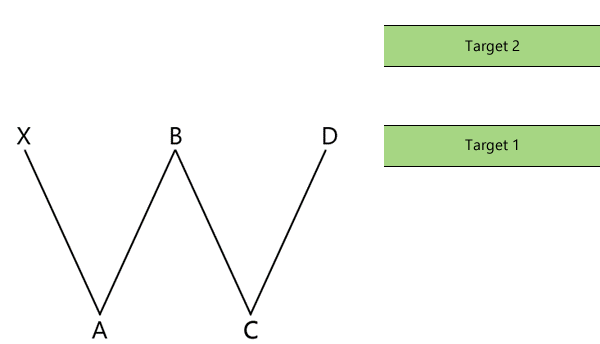
Intraday, the W - double-bottom - pattern is a bullish pattern. Once the price has dipped twice, if the ratios are correct, it becomes likely that the price will continue to D and further upward. This makes the greatest potential for profit being to enter during the C-D retracement and let the other traders make you more and more money. Our algorithm calculates the optimal entry and target levels for you to enter far earlier than other traders and to make money from their actions.
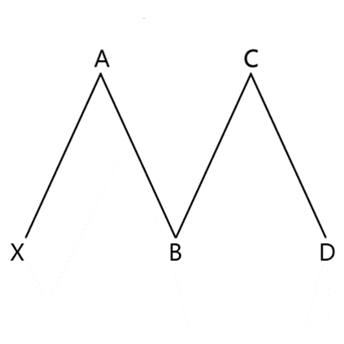
Intraday, the M - double-top - pattern is a bearish pattern. Simply, it is the inverse of the W patterns. This pattern is useful in short-selling and very useful in buying put options. Again, our algorithm will alert you to the forming M pattern and you will be able to enter a trade well before other traders. Buying put options feels a lot easier when you have better information on the likely direction of the stock's price.
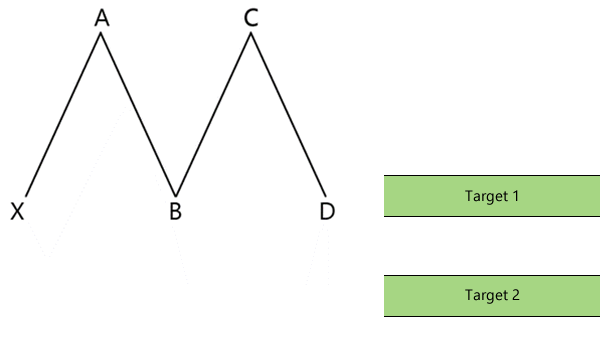
In the real world, a W - double-bottom - pattern can look something like this:
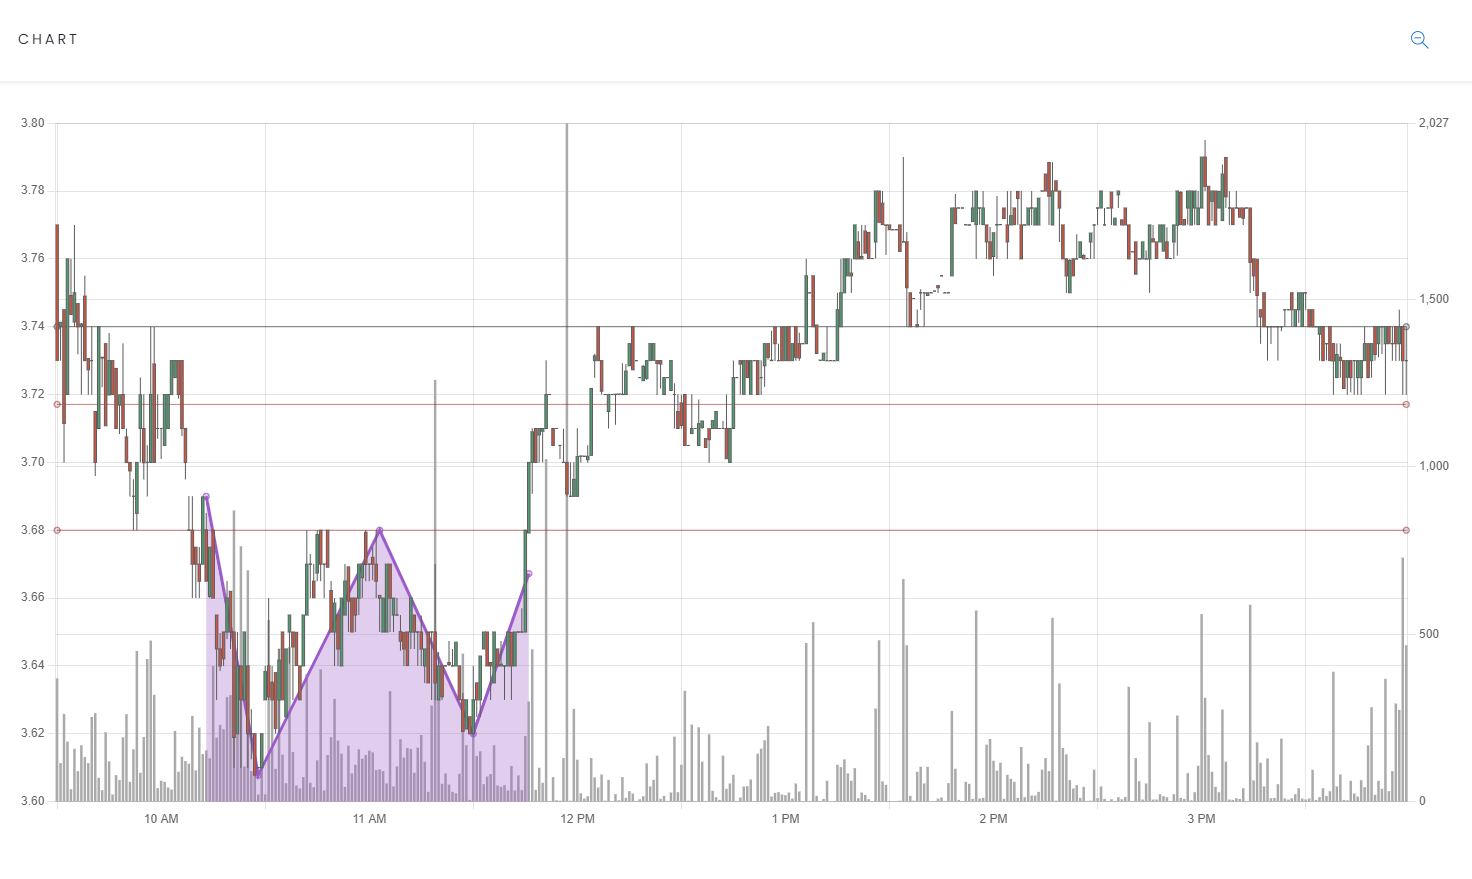
This alert was generated by our algorithm for the stock ATOS on 8/27/2021 at 11:46 AM. It predicted that a trade should be entered at 3.68 and the target should be 3.74. This would be a potential 1.6% profit.
Fibonacci
No discussion of harmonic patterns can occur without mentioning "Fibonacci" – as you have already seen.
And, of course, in mentioning Fibonacci, one immediately thinks of the Fibonacci sequence - or Fibonacci numbers – and the Golden Ratio.
The Golden Ratio, 1.618, is a fascinating thing. It's found not only in mathematics, but also in many ideal ratios for man-made constructs and even in nature.
According to Mario Livio in The Golden Ratio: The Story of Phi, the World’s Most Astonishing Number,
"Some of the greatest mathematical minds of all ages, from Pythagoras and Euclid in ancient Greece, through the medieval Italian mathematician Leonardo of Pisa [better known as Fibonacci] and the Renaissance astronomer Johannes Kepler, to present-day scientific figures such as Oxford physicist Roger Penrose, have spent endless hours over this simple ratio and its properties. ... Biologists, artists, musicians, historians, architects, psychologists, and even mystics have pondered and debated the basis of its ubiquity and appeal. In fact, it is probably fair to say that the Golden Ratio has inspired thinkers of all disciplines like no other number in the history of mathematics."
Fibonacci did not actually study the Golden Ratio. In fact, he never drew the correlation between his sequence and the Golden Ratio.
Fibonacci studied the problem of rabbits and deduced that the number of pairs of rabbits, over generations, increased following a pattern:
1, 1, 2, 3, 5, 8, 13, 21, 34, 55, 89, 144, 233, 377, 610 …
Interestingly, the pattern is simply a number being the sum of the previous two numbers in the sequence.
Starting from zero, this can be calculated as:
F0 = 0, F1 = 1,
and
Fn = Fn-1 + Fn-2
for n > 1
It has since been noted that this also matches honeybee ancestry as well as human chromosome ancestry.
The Golden Ratio is found extensively in geometry, specifically in the shape of pentagons, decagons and spheres and it has been argued that it is found in many of the ratios found in nature.
What does the Fibonacci sequence have to do with the Golden Ratio?
Taking each pair of numbers in the sequence and dividing them (2/1, 3/2, 5/3, 8/5 … 610/377) yields 2, 1.5, 1.667, 1.6, 1.618. The higher in the sequence the pair of numbers exists, the closer the result comes to the Golden Ratio.
In studying patterns in the financial world, it was found that, by using additional calculations of the Fibonacci sequence, such as squaring, square-rooting and reciprocating, the ratios, along with the Golden Ratio itself, matched the ideal ratios for predictable patterns.
The two sets of these Fibonacci-derived ratios are:
0.382, 0.618, 0.786, 1.0, 1, 1, 2.0, 2.62, 3.62, 4.62
and
0.236, 0.886, 1.13, 2.236, 3.14, 4.236
The problem with these patterns is that they are difficult to calculate and require algorithms that are generally used in trading software that include Fibonacci drawing tools. This requires the trader to visually monitor charts for potential patterns and then draw on them to calculate the ratios. This takes a lot of time and focus to recognize the patterns and then costly time to draw the patterns and calculate the ratios.
It’s time to stop doing that.
